
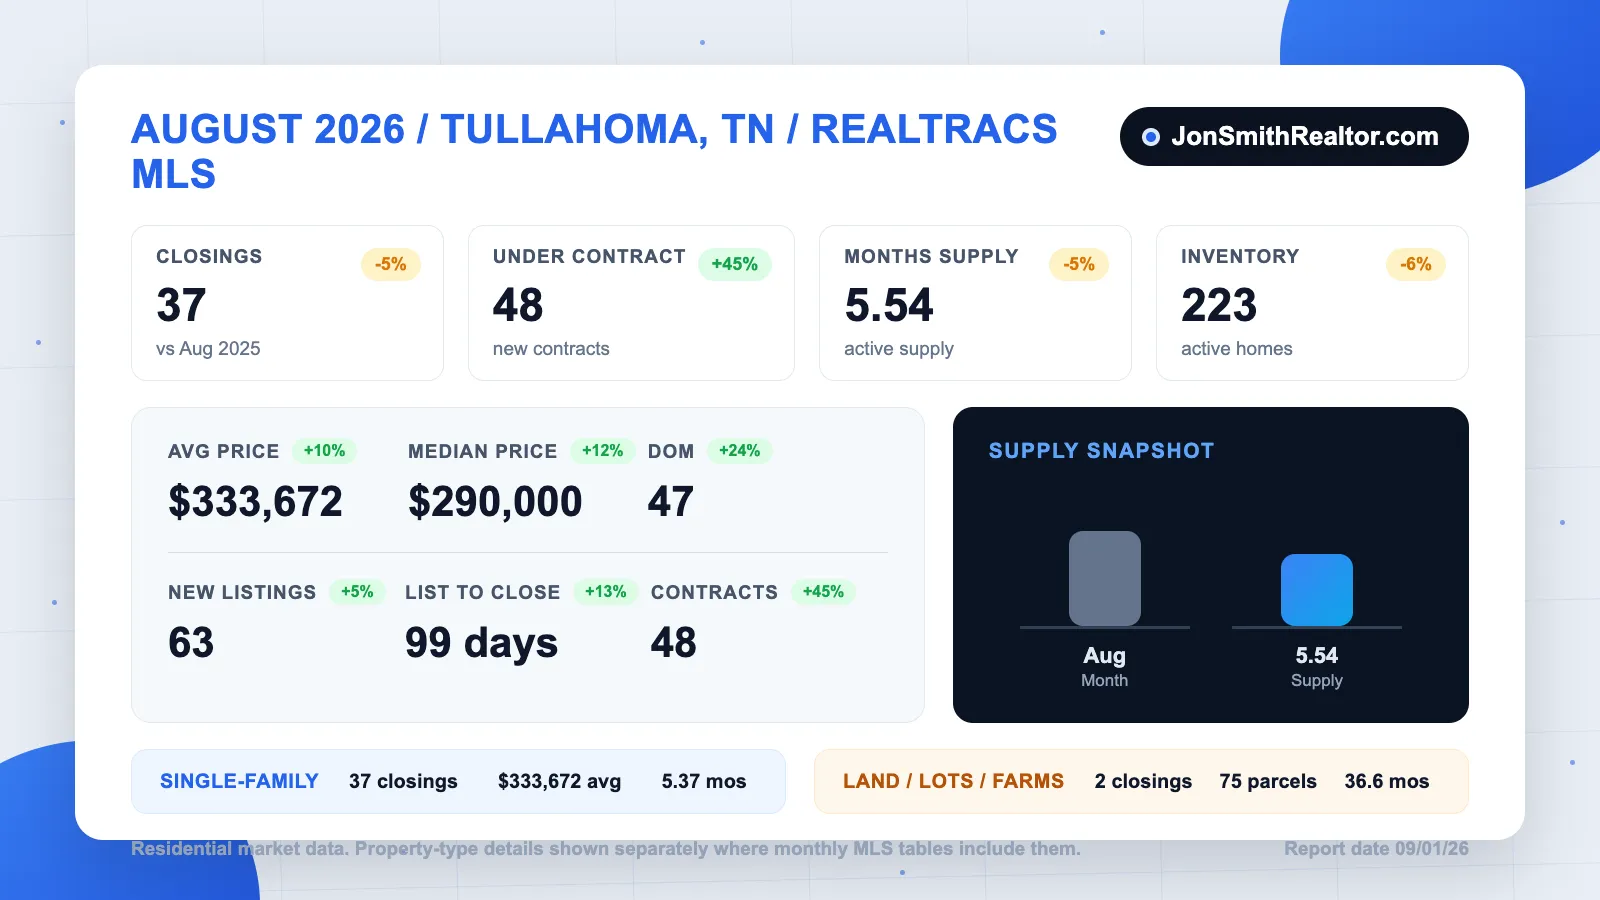

Tullahoma's August looked almost identical to last August on the surface - 37 homes closed, the same number as a year ago. Underneath, almost everything moved. The median sale price climbed 12% over last year to $290,000, sellers finally pulled asking prices back under $400,000, and 48 homes went under contract - the biggest month of buyer commitments since June, and 45% more than last August. The closings table took a breather; the pipeline did not.
These numbers come straight from Realtracs MLS for Tullahoma - not a national estimate drawn from a wide radius around town. And this month the report goes wider than usual: after the full Tullahoma picture and the property-type breakdown, you'll find August numbers for every market I serve - all of Coffee County plus Manchester, Winchester, Estill Springs, Decherd, Lynchburg, Huntland, Cowan, Fayetteville, Shelbyville, Bell Buckle, Christiana, and Murfreesboro. One more upgrade: last year's August data is finally in the system, so the year-over-year table is back. (Catching up? Read the July report for the 33-day sprint that set this month up.)
The Full Market: August 2026 by the Numbers
All residential, Tullahoma, TN - August 2026 vs. August 2025 (Realtracs MLS):
| Metric | Aug 2025 | Aug 2026 | Change |
|---|---|---|---|
| Closings | 39 | 37 | −5% |
| New under contract | 33 | 48 | +45% |
| New listings | 60 | 63 | +5% |
| Total inventory | 238 | 223 | −6% |
| Average sale price | $303,960 | $333,672 | +10% |
| Median sale price | $260,000 | $290,000 | +12% |
| Avg days on market (closed) | 38 | 47 | +9 days |
| Avg list price (active) | $438,789 | $398,331 | −9% |
| List to closed (avg) | 88 days | 99 days | +11 days |
| Months of supply | 5.80 | 5.54 | −5% |
Against last month, August eased the way late summer usually does: 37 closings versus July's 45, and days on market stretched back to 47 after July's unusually fast 33. Neither number is a warning sign. July's 33-day pace was the outlier - the fastest month of the year - and 47 days is right in line with what this market has averaged through 2026. The more telling comparison is the year-over-year one: same closings as last August, a median 12% higher, and half again as many buyers signing contracts.
The Pipeline Story: 48 Contracts Is the Number of the Month
Closings tell you what buyers decided six weeks ago. Contracts tell you what they're deciding right now - and right now they're saying yes. Forty-eight homes went under contract in August, up from 44 in July and 33 in August of last year. Outside of June's blowout 59, that's the strongest month of buyer commitment in 2026.
That pipeline is tomorrow's closing table. With 48 contracts signed in August and the average deal taking about a month from contract to closing, September and early October are set up to be busy - a meaningful shift from the quiet late summer some markets are seeing nationally.
The Price Story: $290,000 and Up 12% in a Year
The median sale price came in at $290,000, up 12% from last August's $260,000, and the average landed at $333,672, up 10%. Just as important is what the median did against July: essentially nothing. July's median was $291,450, so two straight months right at $290,000 marks the steadiest stretch of pricing this year after a spring that whipsawed between $276,500 and $361,300.
Read the two comparisons together and the story is healthy: month to month, prices are stable; year over year, they're clearly up. The typical Tullahoma buyer still got in under $300,000 in August - well below Tennessee's statewide median - which is exactly the value story that keeps drawing Arnold AFB families and Nashville-priced-out buyers down Highway 41A.
Supply Keeps Loosening - and the Price Gap Keeps Closing
Months of supply rose to 5.54 from July's 4.73, the second straight month of loosening, though inventory is actually 6% lighter than it was a year ago at 223 total properties. Call it a balanced market drifting slightly toward buyers.
Now the number I flagged in July. Back then, the average asking price of homes sitting on the market was $411,778 while homes actually sold at an average of $299,460 - a $112,000 gap, the widest of the year. In August that gap narrowed to about $65,000, and it closed from both ends: sellers pulled the average ask down to $398,331 - back under $400,000 - while the mix of homes selling shifted up toward the market's true middle. That's what a market correcting itself in real time looks like. Sellers who repriced found their buyers; the 48 contracts are the proof.
Rates Went Nowhere in August
After drifting up through July, mortgage rates simply parked. The 30-year fixed opened August at 6.69%, eased to 6.65% mid-month, and finished at 6.66% (Freddie Mac) - a five-week stretch where the rate moved four basis points end to end. Nobody got a bargain, but nobody got squeezed either, and the stability itself seems to have helped: buyers who spent July waiting for a better rate stopped waiting and signed. If the fall brings any real rate relief, August's 48-contract pace suggests there's plenty more demand behind it.
Breaking It Down by Property Type
Single-Family Homes: All 37 of the Month's Closings
Every one of August's 37 closings was a single-family home, so the segment numbers track the full market almost exactly:
| Metric | Aug 2025 | Aug 2026 | Change |
|---|---|---|---|
| Closings | 37 | 37 | 0% |
| New under contract | 32 | 48 | +50% |
| Average sale price | $305,147 | $333,672 | +9% |
| Median sale price | $260,000 | $290,000 | +12% |
| Avg days on market (closed) | 32 | 47 | +15 days |
| Months of supply | 5.94 | 5.37 | −10% |
The single-family pipeline is the headline within the headline: 48 new contracts against 32 last August, a 50% jump. Supply at 5.37 months is tighter than a year ago even as the broader market loosens month to month, and the $290,000 median gives buyers and sellers the cleanest benchmark for what a typical Tullahoma home costs right now.
Condos & Townhomes: Quiet Month, Fresh Stock
No condos closed in August and none went under contract - but four new units listed, the first meaningful batch of fresh condo stock in months. Five units are now active at an average ask of $267,328. This segment has spent all of 2026 alternating between silence and sudden bursts whenever new units appear; with four fresh listings on the shelf, September has the raw material for a burst.
Multi-Family: The Drought Holds
July's report predicted the one multi-family property under contract would break the segment's drought in August. Not yet - it's still working toward closing, and no new contracts were signed. Meanwhile the active shelf has grown to eight properties averaging just over $2 million in asking price, dominated by apartment-scale listings that transact on their own timeline. For small investors, the segment remains all watchlist, no action.
Land, Lots & Farms: Two Sales, Both Instant
August 2026 (Realtracs MLS):
| Metric | Aug 2026 |
|---|---|
| Closings | 2 |
| New under contract | 0 |
| Total inventory | 75 parcels |
| Avg sale price (closed) | $231,250 |
| Avg days on market (closed) | 4 |
| Avg list price (active) | $244,673 |
| Months of supply | 36.55 |
Two parcels closed at an average of $231,250, and both went under contract almost immediately - four days on market on average. That's the land market's split personality in one line: parcels priced right disappear in days, while 75 others sit on a shelf that now represents more than three years of supply at the current sales pace. One footnote on the year-over-year swing: last August saw a one-time flood of 69 new parcels hit the market at once; this August brought just 2. If you're a buyer, builder, or investor, the deep inventory is still where your negotiating leverage lives - browse current Tullahoma land for sale or split the difference with homes with acreage.
Around the Region: August in All 13 of My Other Markets
Tullahoma doesn't exist in a vacuum, so here's August for every market I serve - single-family homes, August 2026, straight from Realtracs MLS. Small towns produce small sample sizes, so treat one month's prices in the smallest markets as a snapshot, not a trend:
| Market | Closings | Median sale price | Avg DOM | Months of supply |
|---|---|---|---|---|
| Murfreesboro | 223 | $459,000 | 30 | 4.38 |
| Coffee County | 66 | $300,000 | 43 | 5.29 |
| Tullahoma | 37 | $290,000 | 47 | 5.37 |
| Shelbyville | 35 | $330,000 | 51 | 5.30 |
| Manchester | 31 | $325,990 | 43 | 4.61 |
| Fayetteville | 22 | $287,500 | 60 | 5.47 |
| Winchester | 14 | $380,000 | 99 | 13.76 |
| Estill Springs | 11 | $280,000 | 65 | 5.62 |
| Christiana | 11 | $379,000 | 47 | 7.14 |
| Decherd | 10 | $265,500 | 80 | 3.64 |
| Lynchburg | 4 | $525,000 | 33 | 7.49 |
| Bell Buckle | 3 | $749,900 | 46 | 14.62 |
| Huntland | 2 | $212,500 | 54 | 4.15 |
| Cowan | 1 | $211,500 | 38 | 19.43 |
Coffee County: The County That Refuses to Swing
Zoom out from Tullahoma to all of Coffee County and the picture is remarkably steady: 66 single-family closings (down 10% from last August's 73), a median of exactly $300,000 (up 3%), and 5.29 months of supply, barely changed from a year ago. Manchester carried its share with 31 closings and a median of $325,990, up 2% from last year - and Manchester buyers are getting deals done faster than anyone else in the county at 4.61 months of supply. The one soft spot: Manchester's new contracts fell to 29 from last August's 55, so its early-fall closing pace may thin out.
Franklin County: A Tale of Five Markets
Franklin County is where the region's extremes live this month. Winchester is the market to watch - and to price carefully in. Closings fell to 14 from 23 a year ago, homes that did sell took 99 days, and supply has more than doubled in a year to 13.76 months, deep buyer's-market territory. But the same market just posted 33 new contracts against 22 last August, a 50% jump - so the recovery may already be in the pipeline even as the closed numbers look bleak. Sellers there should price to the contracts being signed now, not to last spring.
Estill Springs logged 11 closings at a $280,000 median; the average fell hard from last August, but that says more about last year's cluster of lake-area luxury sales than about this year's values. Decherd quietly turned in the county's tightest market at 3.64 months of supply and 10 closings - though its $265,500 median reflects a heavy mix of entry-level sales. Cowan and Huntland are the small-sample towns this month - one and two closings respectively - but Cowan's six new contracts against a 14-home shelf hint at a busier fall.
Moore and Lincoln Counties: Lynchburg and Fayetteville
Lynchburg posted the region's flashiest number - a $525,000 median, up 84% from last August - on exactly four sales, which is the definition of a mix story rather than a value story: this month's closings happened to be large properties. The town's real signal is 7.49 months of supply on 27 active homes, the loosest Lynchburg has been in a while. Fayetteville stayed the region's steady value play: 22 closings, a $287,500 median that's within $500 of last August, and supply at a balanced 5.47 months.
Bedford and Rutherford: Shelbyville, Bell Buckle, Christiana, and Murfreesboro
Along the I-24 corridor north, Shelbyville closed 35 homes - down sharply from last August's 55 - but the homes that sold moved a full month faster than a year ago (51 days versus 80) at a median of $330,000, up 2%. Bell Buckle put up a $749,900 median on three horse-country sales; small sample, big properties. Christiana cooled the most in Rutherford County, with closings roughly halved to 11 and supply up to 7.14 months - worth watching if you've been priced out of it before.
And Murfreesboro, the big-city benchmark for the whole region: 223 closings (down 24% from last August), a $459,000 median, homes selling in 30 days, and 4.38 months of supply. Even with the slowdown, it remains the tightest sizable market in this report - and the $169,000 gap between Murfreesboro's median and Tullahoma's is the single best explanation for why buyers keep drifting south down I-24.
What This Means for Sellers
August's message to sellers is the most encouraging since June. Three takeaways:
The buyers are back - meet them. Forty-eight contracts is 45% more buyer commitment than last August. The sellers winning those contracts are the ones who priced below $400,000 asks and into the $290,000-to-$350,000 band where this market actually transacts. The $65,000 ask-versus-sold gap is half what it was in July because repricing worked.
Your competition is thinner than it looks. Total inventory is 6% lighter than a year ago, and single-family supply at 5.37 months is tighter than last August. A well-priced, well-presented listing is not fighting a crowded field - it's standing out against a shelf of overpriced holdovers.
Know which market you're actually in. The regional table above shows supply ranging from 3.64 months in Decherd to 19.43 in Cowan. The same house, the same price, the same month plays completely differently across a 30-minute drive. Start with a free home value review and price from your market's data, not the region's headlines.
What This Means for Buyers
Buyers still hold more cards than they've had most of the year: 223 properties on the Tullahoma market, 5.54 months of supply, and a median sale price under $300,000 - including plenty of homes under $300K. Rates spent the whole month flat in the mid-6.6s, which at least makes the math predictable while you shop.
But August's 48 contracts are your fair warning: the window where you could deliberate for weeks is narrowing. The well-priced listings are exactly the ones the returning buyers are signing on. Get pre-approved first, move quickly on the sharp new listings, and save your negotiating energy for the stale inventory - especially in the loosening markets like Winchester and Christiana, where the leverage genuinely sits with you. For VA-eligible buyers near Arnold AFB, zero-down eligibility keeps taking the sting out of mid-6% rates - details in the VA buyer's guide for Arnold AFB.
The Bottom Line for August
August was the handoff month: July's fast-but-thin market handed off to a broader, steadier one. Closings matched last year, the median held at $290,000 for a second month while running 12% ahead of last August, sellers closed half the pricing gap on their own, and 48 buyers signed contracts - the most in two months and 45% more than a year ago. Around the region, the same rebalancing is playing out at fourteen different speeds, from Decherd's 3.64 months of supply to Cowan's 19.43. Whichever market and whichever side of the table you're on, the number to plan around is the pipeline: the buyers are committing again.
For the deeper local read - inventory by price band, what buyers are responding to, and how to time your move - visit the Tullahoma Market Report page, or the Coffee County Market Report for the wider area.
Have a question about your specific situation? Reach out directly or call (615) 610-1293 - I'm happy to give you a straight answer about whether now is your moment.
Jon Smith is a Tullahoma REALTOR® with Orchard, serving Tullahoma, Manchester, Winchester, Estill Springs, and the Arnold AFB / Tims Ford Lake area. Market statistics from Realtracs MLS (Residential: All; Residential: Single Family; Residential: Condo; Multi-Family; and Land, Lots, Farms for Tullahoma, TN; Residential: Single Family for all other listed markets; August 2026; report date 09/01/26). Mortgage rate data from Freddie Mac's weekly Primary Mortgage Market Survey. Statistics deemed reliable but not guaranteed and subject to MLS revision.