
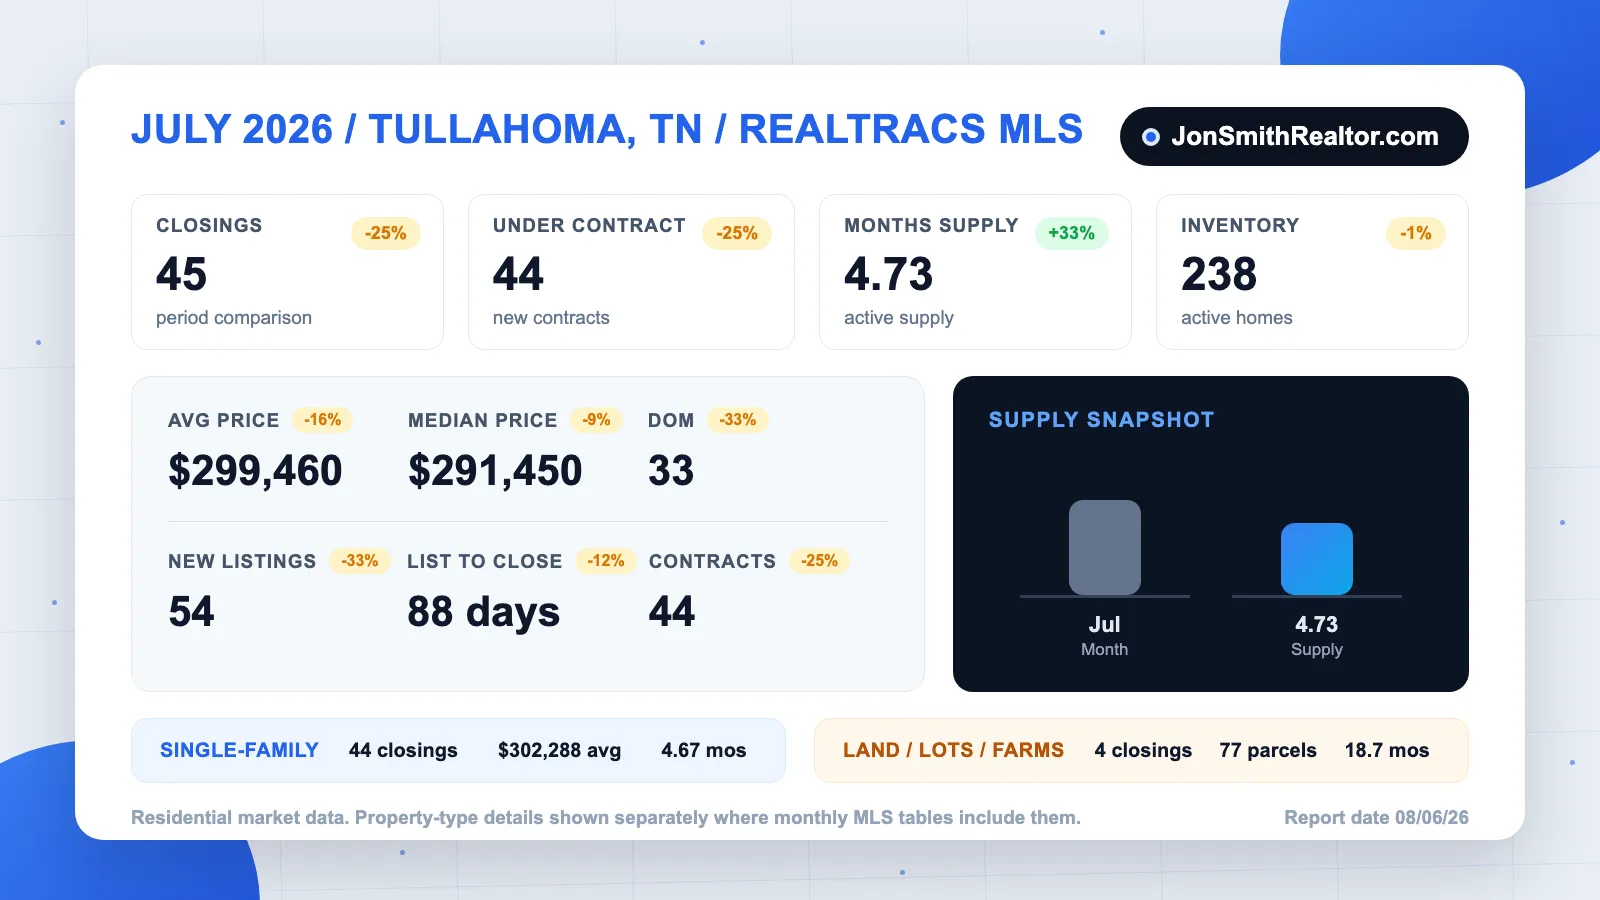

After two straight months at a 60-closing sprint, Tullahoma's market finally downshifted in July. Fewer homes sold, fewer went under contract, and supply loosened for the first time since winter. But here's the number that should stop you from calling it a slowdown: the homes that did sell found their buyers in just 33 days - the fastest pace of any month in 2026.
These numbers come straight from Realtracs MLS for Tullahoma - not a national estimate drawn from a wide radius around town. Here's the full residential picture first, then the breakdown by property type - single-family, condos, multi-family, and land - and what it all means if you're buying or selling in Tullahoma, Coffee County, or the Arnold AFB and Tims Ford Lake area. (Catching up? Read the June report for the record-setting month that set this one up.)
The Full Market: July 2026 by the Numbers
All residential, Tullahoma, TN - July 2026 vs. June 2026 (Realtracs MLS):
| Metric | Jun 2026 | Jul 2026 | Change |
|---|---|---|---|
| Closings | 60 | 45 | −25% |
| New under contract | 59 | 44 | −25% |
| New listings | 80 | 54 | −33% |
| Total inventory | 241 | 238 | −1% |
| Average sale price | $355,017 | $299,460 | −16% |
| Median sale price | $320,000 | $291,450 | −9% |
| Avg days on market (closed) | 49 | 33 | −16 days |
| Avg list price (active) | $395,474 | $411,778 | +4% |
| List to closed (avg) | 100 days | 88 days | −12 days |
| Months of supply | 3.55 | 4.73 | +33% |
June and May each posted 60 closings - the two strongest months of the year, back to back. July eased to 45. That's a real step down, but keep it in perspective: 45 closings still beats every month of the first quarter, and it's nearly identical to April's 41. The market didn't stall; it came down from a sprint to a stride.
The pipeline tells the same story. Forty-four homes went under contract in July, down from June's 59, and just 54 new listings hit the market after June's flood of 80. With both sides of the market easing together, total inventory barely moved - 238 homes versus 241 in June.
The Speed Story: 33 Days Is the Number of the Month
Here's July's genuine headline. Homes that closed averaged just 33 days on market - the fastest of any month in 2026, and it isn't close. The year started at 80 days in January, ground down through the spring, hit 49 in June, and now 33. The full journey from list date to closing table averaged 88 days, down from 100 in June, and once a home went under contract, it closed in roughly six weeks.
Fewer buyers were shopping in July - but the ones who were shopping were serious, decided quickly, and closed clean. If your home is priced right and shows well, this is the fastest market Tullahoma has offered all year.
The Price Story: The Entry-Level Market Did the Business
The average sale price came in at $299,460 and the median at $291,450 - the first sub-$300,000 median since February. Before anyone reads that as values falling, look at what actually happened: July's action concentrated in the entry and mid-level price bands, where Tullahoma does most of its volume. It's the mirror image of May, when a run of move-up and lake-area sales pushed the average past $404K - July simply rotated to the price bands where Tullahoma does most of its business. The 2026 median has bounced between $276,500 and $361,300 month to month all year; in a market this size, the mix of what sells moves these numbers far more than underlying values do.
For buyers, though, the takeaway is concrete: the typical July buyer got into a Tullahoma home for under $300,000, well below Tennessee's statewide median. That value story is exactly why this market keeps drawing Arnold AFB families and Nashville-priced-out buyers.
Now the number sellers need to sit with. The average asking price of homes still sitting on the market is $411,778 - roughly $112,000 above the average price of homes actually selling, and the gap nearly tripled from June's $40,000. Some of that is mix: higher-end listings waiting on a thinner pool of move-up buyers while entry-level homes fly. But a gap that wide sends one unmistakable message: the homes selling in 33 days are the ones priced to the market, and the ones parked on the shelf are propping up that $411K average.
Supply: Back Toward Balance
Months of supply rose from 3.55 in June to 4.73 in July - the first meaningful loosening since winter. The path so far this year: 6.09 in January, steadily down to 3.55 by June, now back to 4.73. That puts Tullahoma near the balanced zone rather than the seller-leaning territory of early summer.
Two things are true at once here. Sellers no longer have June's scarcity working for them - buyers have more room to breathe, compare, and negotiate. And yet the market is rewarding well-priced homes faster than at any point in 2026. Balance hasn't slowed the good listings down; it's exposed the overpriced ones.
Rates Drifted the Wrong Way
Mortgage rates worked against the market in July. The 30-year fixed opened the month around 6.43% - the best level of the summer - then climbed steadily to 6.66% by the final week (Freddie Mac). That drift likely explains some of July's cooler buyer traffic: the buyers who locked in late June and early July got the best deal of the season, and some of the rest stepped back to wait.
Breaking It Down by Property Type
Single-Family Homes: The Engine of the Market
Single-family homes were 44 of July's 45 closings and 231 of the 238 properties in inventory:
| Metric | Jun 2026 | Jul 2026 | Change |
|---|---|---|---|
| Closings | 59 | 44 | −25% |
| Average sale price | $355,783 | $302,288 | −15% |
| Median sale price | $325,000 | $295,725 | −9% |
| Avg days on market (closed) | 49 | 33 | −16 days |
| Months of supply | 3.5 | 4.67 | +33% |
The single-family story mirrors the full market: fewer closings, faster sales, and a median that slid under $300,000 as the entry-level bands did the business. The median single-family sale at $295,725 gives buyers and sellers the most useful single benchmark for "what does a typical Tullahoma home cost right now."
Condos & Townhomes: One Quiet Sale
One condo closed in July at $175,000 after 68 days on market, and seven units remain in inventory at 7.05 months of supply. The segment stays true to its 2026 pattern: months of quiet punctuated by quick bursts whenever fresh units list. Two new listings did arrive in July, so buyers wanting low-maintenance living have a little fresh stock to watch.
Multi-Family: A Shutout Month, With One Bright Spot
No multi-family properties closed in July - the segment's first shutout in months. The bright spot: one property went under contract after 98 days on market, so August should break the drought. The eight active listings still tell the same story they have all year, with an average asking price above $2 million dominated by a few apartment-scale properties that transact on an entirely different timeline than the small investor stock that usually moves fast here.
Land, Lots & Farms: Small Lots Moved - Fast
While Tullahoma homes stayed the main event, land quietly had its most interesting month of the year. July 2026 (Realtracs MLS):
| Metric | Jul 2026 |
|---|---|
| Closings | 4 |
| New under contract | 4 |
| Total inventory | 77 parcels |
| Avg sale price (closed) | $95,875 |
| Avg days on market (closed) | 20 |
| Avg list price (active) | $229,311 |
| Months of supply | 18.7 |
Four parcels closed at an average of just $95,875 - and they moved in an average of 20 days, faster than the housing market itself. That's the whipsaw this segment produces every month: June's closings skewed toward large acreage and averaged $547,944; July rotated to small lots that priced right and flew. With only a handful of closings each month, take land prices as a snapshot, not a trend.
The big picture hasn't changed: 77 parcels on the market and 18.7 months of supply is still a deep buyer's market, versus 4.73 months for homes. But July offered land sellers a genuine playbook - the parcels that sold were priced sharply and went under contract in under three weeks, while the shelf inventory asks an average of $229,311 and waits. If you're a buyer, builder, or investor, this is still where your negotiating leverage lives: browse current Tullahoma land for sale or split the difference with homes with acreage.
What This Means for Sellers
July's message to sellers is more nuanced than June's, but it's not bad news. Three takeaways:
Price to the 45 that sold, not the 238 that are sitting. The gap between average asking ($411,778) and average selling ($299,460) is the widest of the year. The comps that matter are July's closings - and the reward for pricing to them is a 33-day sale, the fastest this market has moved in 2026.
Speed is your friend, but the window matters. Supply is loosening and rates drifted up all month. A home launched sharp - priced right, presented well - is still selling in a month. A home priced at spring's peak numbers joins the shelf inventory that's been accumulating since June.
Know where you actually stand before you list. If you're in the entry or mid bands under $350K, you're in the strongest part of the market. Above $400K, plan for a longer runway and sharper positioning. Either way, start with a free Tullahoma home value review and price from data, not hope.
What This Means for Buyers
July quietly handed buyers their best conditions since early spring. Supply is back near balanced at 4.73 months, 238 homes are on the market, and the median sale price dipped under $300,000 - including plenty of homes under $300K. The frenzy cooled just enough to let you compare homes, sleep on a decision, and negotiate - things June buyers couldn't always do.
For VA-eligible buyers near Arnold AFB, zero-down eligibility takes some of the sting out of July's rate drift - details in the VA buyer's guide for Arnold AFB.
The catch is the same one it's been all year: the well-priced homes are exactly the ones selling in 33 days. A balanced market gives you leverage on the listings that have been sitting - not on the sharp new listing everyone else also noticed. Get pre-approved before you tour, watch rates closely (July proved they can move a quarter point in weeks), and be ready to act fast on the good ones while taking your time on the stale ones.
The Bottom Line for July
Tullahoma's July was a downshift, not a downturn: closings eased from a record June pace to a solid 45, supply loosened back toward balance at 4.73 months, and the median dipped below $300,000 as the entry-level market did the heavy lifting. Meanwhile the homes that sold moved faster than in any month this year. The market has split cleanly in two - priced-right homes selling in a month, overpriced inventory building up $112,000 above what buyers are actually paying. Whichever side of the table you're on, that gap is the number to plan around.
For the deeper local read - inventory by price band, what buyers are responding to, and how to time your move - visit the Tullahoma Market Report page, or the Coffee County Market Report for the wider area.
Have a question about your specific situation? Reach out directly or call (615) 610-1293 - I'm happy to give you a straight answer about whether now is your moment.
Jon Smith is a Tullahoma REALTOR® with Orchard, serving Tullahoma, Manchester, Winchester, Estill Springs, and the Arnold AFB / Tims Ford Lake area. Market statistics from Realtracs MLS (Residential: All; Residential: Single Family; Residential: Condo; Multi-Family; and Land, Lots, Farms; Tullahoma, TN; July 2026; report date 08/06/26). Mortgage rate data from Freddie Mac's weekly Primary Mortgage Market Survey. Statistics deemed reliable but not guaranteed and subject to MLS revision.