
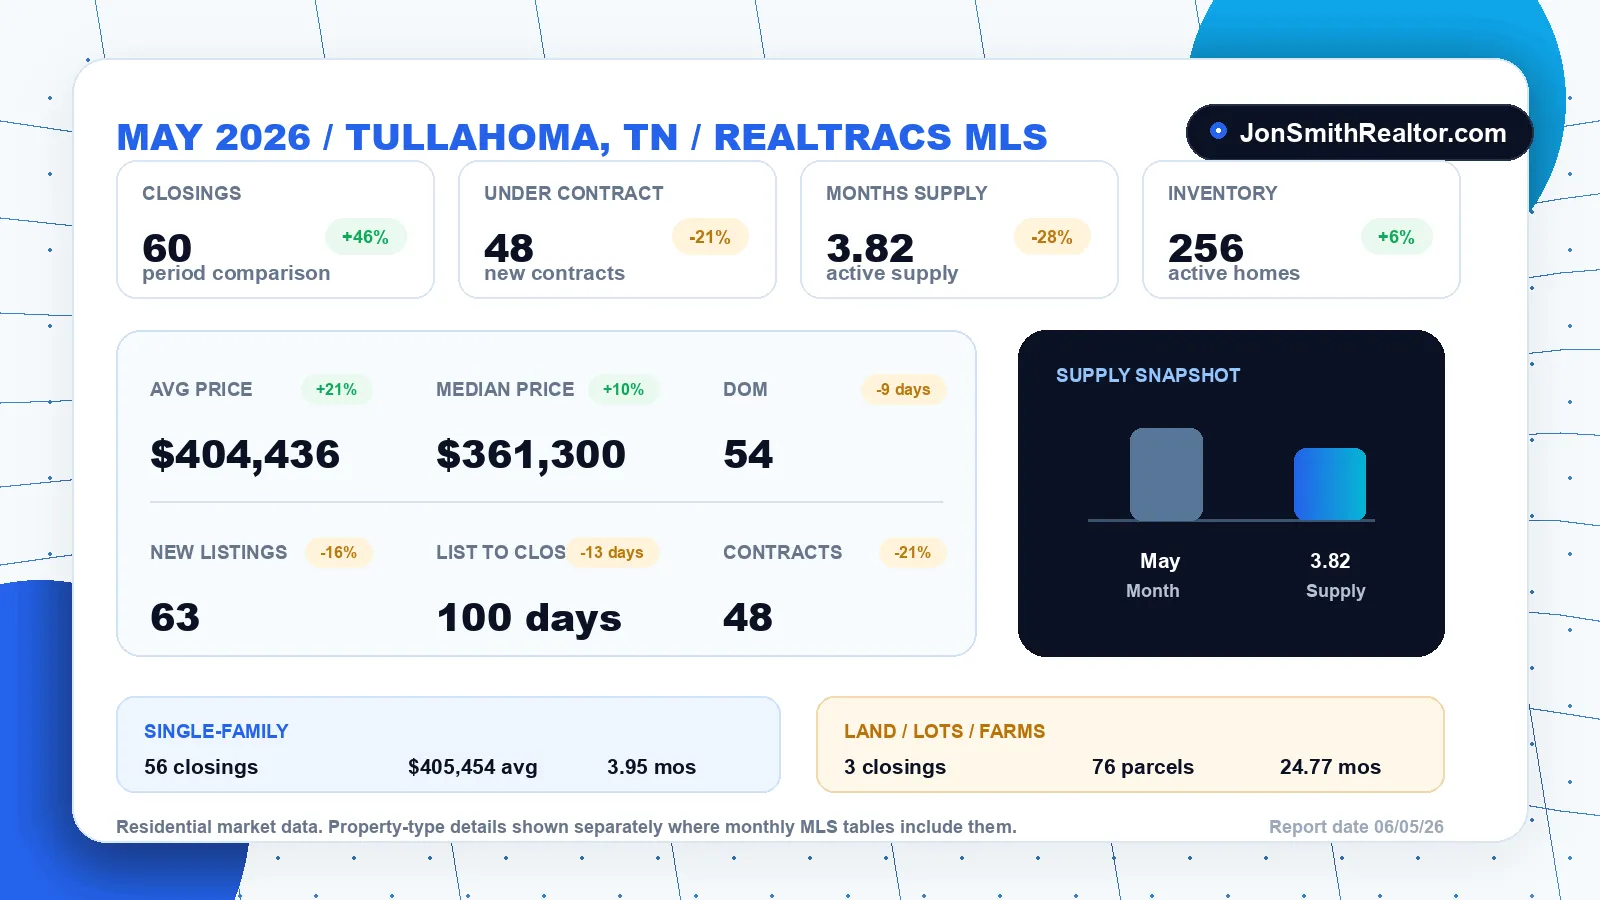

May is when the Tullahoma market shows you what kind of year it's going to be, and this May made a statement. Sixty homes closed - roughly two a day, weekends included - and the buyers writing contracts weren't just shopping the entry-level shelf. The average sale price crossed the $400,000 mark, driven by real activity in the move-up and upper price bands.
These numbers come straight from Realtracs MLS for Tullahoma - not a national estimate drawn from a wide radius around town. Here's the full picture versus April, then the breakdown by property type, and what it means for buyers and sellers in Tullahoma, Coffee County, and the Arnold AFB and Tims Ford Lake area. (Catching up? The April report covers the demand surge that set May up.)
The Full Market: May 2026 by the Numbers
All residential, Tullahoma, TN - May 2026 vs. April 2026 (Realtracs MLS):
| Metric | Apr 2026 | May 2026 | Change |
|---|---|---|---|
| Closings | 41 | 60 | +46% |
| New under contract | 61 | 48 | −21% |
| Under contract inventory (avg) | 75 | 84 | +12% |
| New listings | 75 | 63 | −16% |
| Total inventory | 241 | 256 | +6% |
| Average sale price | $332,977 | $404,436 | +21% |
| Median sale price | $327,000 | $361,300 | +10% |
| Avg days on market (closed) | 63 | 54 | −9 days |
| List to closed (avg) | 113 days | 100 days | −13 days |
| Months of supply | 5.29 | 3.82 | −28% |
A Genuinely Busy Spring Market
Sixty closings - up 46% from April's 41 - is a serious pace for Tullahoma, and it's no mystery where they came from: April's record 61 contracts became May's closing appointments. The pipeline stayed fat too, with an average of 84 homes under contract throughout the month, even as new contract signings eased to 48 while buyers worked through everything they'd already grabbed.
Sellers showed up for spring too, with 63 new listings hitting the market. But at May's sales pace, the 256 homes in total inventory work out to just 3.82 months of supply - down 28% from April and the first month of 2026 below the four-month line. Under four months tilts the table toward sellers: after opening the year balanced at 6.09 months, Tullahoma spent May as a moderately seller-favored market, not a frenzied one.
The Price Story: The Move-Up Market Woke Up
May's headline number is the average sale price of $404,436 - up 21% from April - with the median at $361,300, up 10%. When the average runs that far ahead of the median, it means the upper end of the market was doing real business - larger homes, newer construction, and premium properties around the lake and golf corridors found buyers in May. After a winter carried almost entirely by entry-level sales, the move-up market's return completed the spring.
Here's the detail that should get sellers' attention: the average home that closed in May sold for more than the $396,095 average asking price of what was still sitting on the market. Read that again - the well-positioned upper-end inventory cleared, while the remaining actives are, on average, priced below what just sold. When quality homes are correctly priced in this market, buyers are stepping up for them.
Timelines: Plan on Seven to Eight Weeks to a Contract
Homes that closed in May averaged 54 days on market, and the full journey from list date to closing table averaged 100 days. That's a healthy, deliberate market - buyers are moving with intention, not panic. For sellers, it means the launch strategy matters: a home that misses its audience in the first few weeks starts aging in a market where buyers can see exactly how long you've been listed.
Breaking It Down by Property Type
Single-Family Homes: The Core of the Market
Single-family homes accounted for 56 of May's 60 closings and 246 of the 256 properties in inventory:
| Metric | Apr 2026 | May 2026 | Change |
|---|---|---|---|
| Closings | 41 | 56 | +37% |
| New under contract | 58 | 47 | −19% |
| Average sale price | $332,977 | $405,454 | +22% |
| Median sale price | $327,000 | $363,800 | +11% |
| Avg days on market (closed) | 63 | 55 | −8 days |
| Months of supply | 5.02 | 3.95 | −21% |
The single-family numbers mirror the full market - just under four months of supply, a median sale of $363,800, and an average north of $405K on upper-band strength. If you own a single-family home in Tullahoma, this is your benchmark table.
Condos & Townhomes: April's Pipeline Converted
Three condos closed in May - the segment's best month of the year, and exactly what April's three pending contracts predicted. The sales averaged $230,250 (median $167,500 - a mixed bag of unit types), and they moved fast: 19 days on market on average. With only nine attached homes in total inventory and supply at 2.59 months, Tullahoma's smallest segment was quietly its tightest in May. Condo owners thinking about selling: this is what a favorable window looks like.
Multi-Family: One Small Sale, Big Listings Still Waiting
One multi-family property closed in May at $320,000 after just nine days on market - small investor stock continues to move quickly whenever it appears. The rest of the multi-family shelf tells a different story: the average active asking price sits near $1.9 million, reflecting a handful of apartment-scale listings that trade on a completely different timeline. Nine properties were in inventory, the segment's high for the year.
Land, Lots & Farms: Priced Right, Land Moves in Days - Otherwise It Waits
Land tells a completely different story. May 2026 (Realtracs MLS):
| Metric | May 2026 |
|---|---|
| Closings | 3 |
| New under contract | 3 |
| Total inventory | 76 parcels |
| Avg sale price (closed) | $68,000 |
| Avg list price (active) | $246,956 |
| Months of supply | 24.77 |
With 76 parcels listed and only 3 May sales, land supply sits at nearly 25 months - a deep buyer's market, versus 3.82 months for homes, and a cooldown from the spring's burst of 13 land closings across March and April. But look at what actually sold: modest lots averaging $68,000 that went under contract almost immediately. Meanwhile, the average parcel still sitting is asking nearly $247,000. The lesson cuts both ways: priced-right land finds its buyer fast, and everything else waits - sometimes for years. With only three closings, treat the price figures as a snapshot, not a trend.
If you're a buyer or builder, land is where your leverage lives. Browse current Tullahoma land for sale or split the difference with homes with acreage.
What This Means for Sellers
May confirmed that the spring window is real - and that it rewards preparation over hope. Three takeaways:
The upper end is in play. If you've been waiting to list a larger or higher-end home because "nothing expensive sells here," May's $404K average says otherwise. Qualified move-up buyers are active.
Price to what's closing. Buyers had 256 options in May. The homes that sold in 54 days were the ones priced against actual recent sales - not against a neighbor's wishful asking price.
Presentation earns the premium. With supply under four months, sellers have the edge - but the homes selling at strong numbers are the clean, well-prepped, well-photographed ones. If you want to know what your home would command in this market, start with a free Tullahoma home value review.
What This Means for Buyers
A sub-four-month market requires you to be organized, but May still offered real footing. Inventory of 256 homes means genuine choice across price bands - browse what's on the market now via Tullahoma homes for sale. The median sale at $361,300 remains below Tennessee's statewide median (roughly $384,000 per Redfin), and far below what comparable homes cost up the highway toward Nashville.
Mortgage rates spent May in the mid-6s - Freddie Mac's weekly survey ranged from about 6.30% to 6.51% over the month. Not cheap money, but stable enough to plan around, and every well-negotiated seller credit or rate buydown helps. For VA-eligible buyers near Arnold AFB, zero-down eligibility changes the math entirely - details in the VA buyer's guide for Arnold AFB.
The main advice: get pre-approved before you tour. With 84 homes under contract at any given moment in May, the good ones had competition.
The Bottom Line for May
May 2026 was a confident spring market: two closings a day, a $404K average sale price on real upper-end activity, supply under four months, and a fat pipeline of pending contracts pointing to a busy early summer. Sellers with well-priced, well-presented homes had the wind at their backs. Buyers had selection, stable rates, and a median price that still undercuts the state - they just couldn't afford to hesitate on the right house. And land remained the outlier: nearly 25 months of supply, where only sharp pricing moves a parcel.
For the deeper local read - inventory by price band, what buyers are responding to, and how to time your move - visit the Tullahoma Market Report page, or the Coffee County Market Report for the wider area.
Have a question about your specific situation? Reach out directly or call (615) 610-1293 - I'm happy to give you a straight answer about whether now is your moment.
Jon Smith is a Tullahoma REALTOR® with Orchard, serving Tullahoma, Manchester, Winchester, Estill Springs, and the Arnold AFB / Tims Ford Lake area. Market statistics from Realtracs MLS (Residential: All; Residential: Single Family; Residential: Condo; Multi-Family; and Land, Lots, Farms; Tullahoma, TN; May 2026; report date 07/05/26). Mortgage rate data from Freddie Mac's Primary Mortgage Market Survey; state median from Redfin. Statistics deemed reliable but not guaranteed and subject to MLS revision.