

If you only read national headlines, you'd think the housing market spent June asleep. Tullahoma didn't get the memo. June 2026 was the busiest June this market has seen in years - more homes sold, more buyers went under contract, and supply tightened noticeably compared to last summer.
These numbers come straight from Realtracs MLS for Tullahoma - not a national estimate drawn from a wide radius around town. Here's the full residential picture first, then the breakdown by property type - single-family, condos, multi-family, and land - and what it all means if you're buying or selling in Tullahoma, Coffee County, or the Arnold AFB and Tims Ford Lake area. (Catching up? Read the May report for the month that set this one up.)
The Full Market: June 2026 by the Numbers
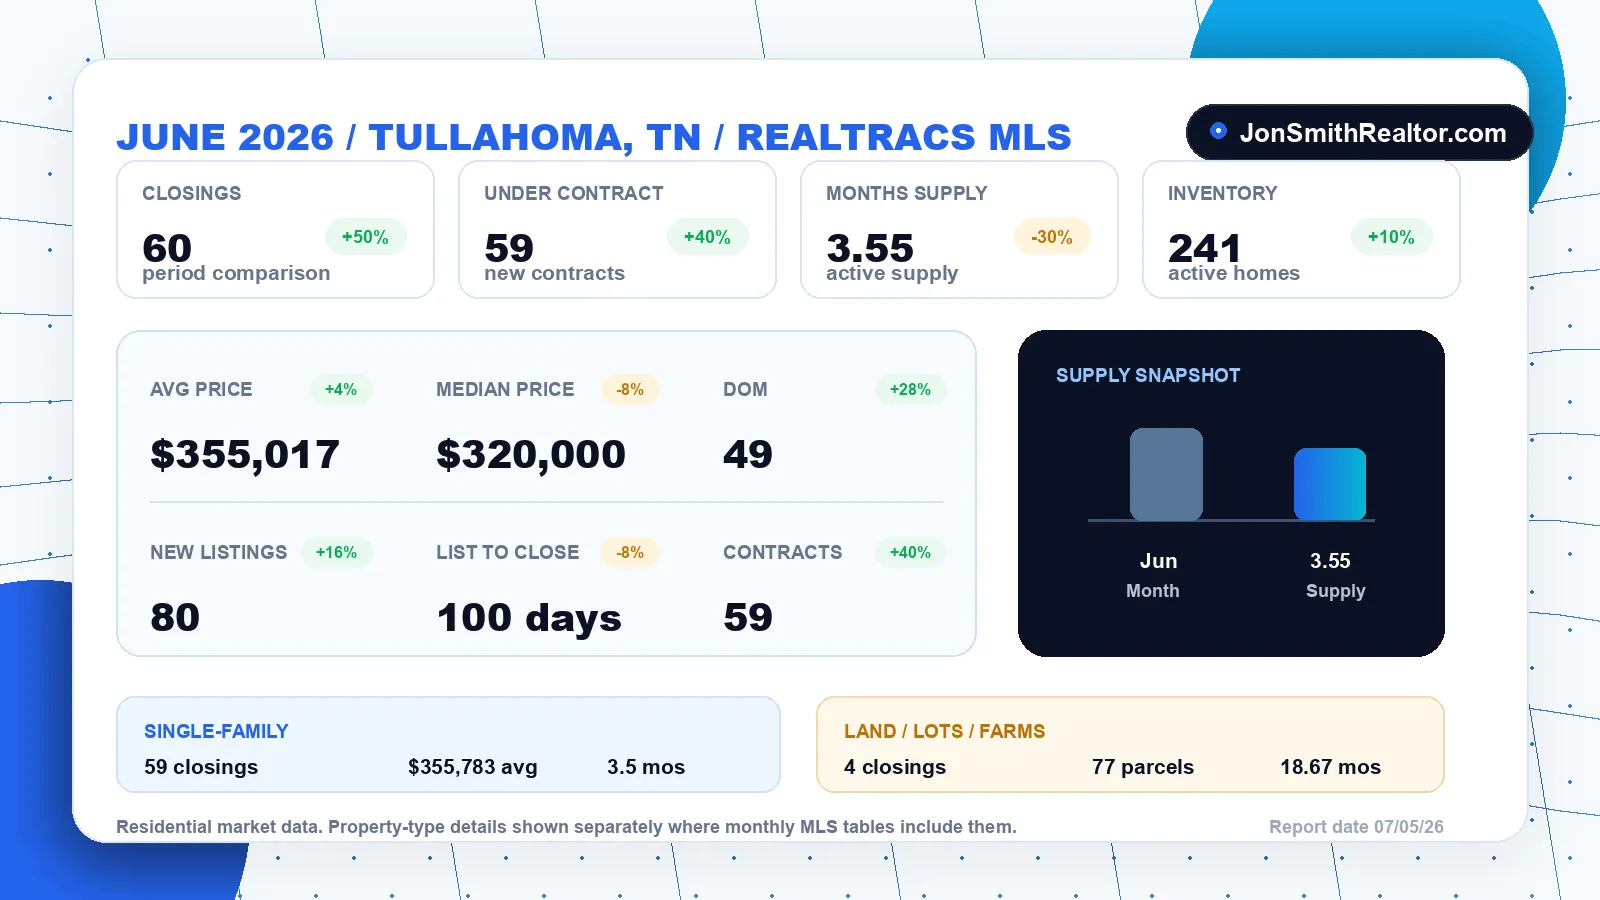
All residential, Tullahoma, TN - June 2026 vs. June 2025 (Realtracs MLS):
| Metric | Jun 2025 | Jun 2026 | Change |
|---|---|---|---|
| Closings | 40 | 60 | +50% |
| New under contract | 42 | 59 | +40% |
| New listings | 69 | 80 | +16% |
| Average sale price | $340,853 | $355,017 | +4% |
| Median sale price | $348,735 | $320,000 | −8% |
| Avg days on market (closed) | 39 | 49 | +28% |
| Total inventory | 218 | 241 | +10% |
| Avg list price (active) | $442,715 | $395,474 | −11% |
| List to closed (avg) | 109 days | 100 days | −8% |
| Months of supply | 5.06 | 3.55 | −30% |
How June Compared to May
The year-over-year jump is the headline, but the month-over-month view shows a market holding its new altitude:
| Metric | May 2026 | Jun 2026 | Change |
|---|---|---|---|
| Closings | 60 | 60 | even |
| New under contract | 48 | 59 | +23% |
| New listings | 63 | 80 | +27% |
| Total inventory | 256 | 241 | −6% |
| Median sale price | $361,300 | $320,000 | −11% |
| Months of supply | 3.82 | 3.55 | −7% |
June matched May's 60-closing pace - the two strongest months of the year, back to back - while the buyer pipeline reloaded, with new contracts up 23%. Even an influx of 80 new listings couldn't rebuild inventory: total homes on the market fell 6%, and supply touched 3.55 months, the tightest of 2026. For perspective, the year opened at 6.09 months in January. The first half of 2026 took Tullahoma from a balanced market to a seller-leaning one in six steady steps.
Demand Showed Up in a Big Way
Sixty homes closed in June - up 50% from the 40 that closed last June. And the pipeline behind them is just as strong: 59 more went under contract during the month, up 40% year over year. That's not a one-month blip; that's buyers who spent the last two summers on the sidelines deciding it's time.
Sellers responded too - 80 new listings hit the market, the most for any June in recent memory - but demand outran supply anyway. Even with more homes listed, months of supply fell from 5.06 to 3.55. In plain terms: at June's sales pace, everything on the market would sell in about three and a half months. A year ago Tullahoma was a balanced market; anything under four months tilts the table toward sellers.
The Price Story: Read Both Numbers
June's prices tell two stories, and both matter.
The average sale price hit $355,017, up 4% from last June - and the third straight June increase ($335,981 in 2024, $340,853 in 2025). Values in Tullahoma are still climbing.
The median sale price came in at $320,000, down 8% from last June. Before anyone panics: this isn't values falling - it's the mix of what sold shifting. With 20 more closings than last June, a much bigger share of the action happened in the entry and mid-level price bands, which pulls the median down even while the typical home holds or gains value. It's also the flip side of May, when move-up sales pushed the average past $404K - June simply rotated back to the price bands where Tullahoma does most of its business. New construction starting in the low $300,000s at communities like Stillwater and Sagewood is feeding exactly that band.
One more number worth noticing: the average list price of homes still sitting on the market is $395,474 - about $40,000 above the average price of homes actually selling. The market is active, but it is not forgiving overpriced listings.
Homes Took a Little Longer - With an Asterisk
Closed sales averaged 49 days on market, up from 39 last June. Buyers are shopping carefully and negotiating, even in a tightening market. But the full start-to-finish timeline - list date to closing day - actually improved, from 109 days to 100. Once a home finds its buyer, deals are getting done faster and cleaner.
The pattern underneath: correctly priced, well-presented homes are moving quickly, while the overpriced segment sits and stretches the average. In a market where active listings are priced $40K above what's closing, pricing right at launch is the difference between selling in weeks and becoming stale inventory.
Breaking It Down by Property Type
Single-Family Homes: The Engine of the Market
Single-family homes are the Tullahoma market - 59 of June's 60 closings and 235 of the 241 homes in inventory:
| Metric | Jun 2025 | Jun 2026 | Change |
|---|---|---|---|
| Closings | 40 | 59 | +48% |
| Average sale price | $340,853 | $355,783 | +4% |
| Median sale price | $348,735 | $325,000 | −7% |
| Avg days on market (closed) | 39 | 49 | +26% |
| Months of supply | 4.86 | 3.5 | −28% |
The single-family story mirrors the full market: demand up nearly 50%, average price at a June record, and supply compressing to 3.5 months. The median single-family sale at $325,000 gives buyers and sellers the most useful single benchmark for "what does a typical Tullahoma home cost right now."
Condos & Townhomes: One Sale After May's Rush
One condo closed in June at $309,800 after 90 days on market, following May's three-closing rush that largely cleared the pipeline. Seven units remain in inventory. The segment stays true to its 2026 pattern: months of quiet punctuated by quick bursts whenever fresh units list, so buyers wanting low-maintenance living should watch closely rather than casually.
Multi-Family: Small Stock Still Moves Fast
One multi-family property closed in June at $220,000 after just ten days on market - continuing the year's clearest multi-family pattern: small investor properties sell almost immediately when they appear. The eight active listings tell the other half of the story, with an average asking price above $2 million dominated by a few apartment-scale properties that transact on an entirely different timeline.
Land, Lots & Farms: A Completely Different Market
While Tullahoma homes tightened, land is the mirror image. June 2026 (Realtracs MLS):
| Metric | Jun 2026 |
|---|---|
| Closings | 4 |
| New under contract | 7 |
| Total inventory | 77 parcels |
| Avg days on market (closed) | 266 |
| Avg list price (active) | $261,255 |
| Months of supply | 18.67 |
With 77 parcels on the market and only 4 June sales, land supply sits at nearly 19 months - a deep buyer's market, versus 3.55 months for homes. The parcels that did close took an average of 266 days to find their buyer, and June's sales skewed toward a few large acreage transactions - which is why the closed prices ($547,944 average) look nothing like the $261,255 average asking price of what's still listed, or May's $68,000 average when small lots dominated. With only a handful of closings each month, land prices whipsaw on mix, so take them as a snapshot, not a trend. The encouraging signal for land sellers: seven parcels went under contract in June, the segment's best pipeline month since spring.
What it means: if you're selling land, pricing and marketing matter more here than anywhere else in the market - though June's 7 new contracts prove serious buyers are out there. If you're a buyer, builder, or investor, this is where your negotiating leverage lives: wide selection, long seller wait times, and motivated owners. Browse current Tullahoma land for sale or split the difference with homes with acreage.
What This Means for Sellers
June's numbers are about as friendly a setup as Tullahoma sellers have seen in a couple of years - 3.55 months of supply, buyer demand up 40–50%, and average prices at a June record. But the $395K-list vs. $355K-sold gap is a warning: buyers are active, not desperate. Three takeaways:
Price to what's closing, not what's sitting. The homes setting the comps are the 60 that sold - not the listings that have been on the market since spring asking 2024 prices.
Your competition includes brand-new homes. If you're selling in the $275K–$375K band, buyers are comparing you directly against new construction. Condition, presentation, and pre-list prep carry real dollar value.
The window is now. Under-contract activity this strong in June usually means a busy July and August. If you want to know exactly where your home fits in the current competition, start with a free Tullahoma home value review.
What This Means for Buyers
Don't let the seller-leaning stats scare you off - June had real openings for buyers. Total inventory was up 10% with 241 homes on the market, so there's more to choose from than last year, including homes under $300K. The median sale at $320,000 also sits well below Tennessee's statewide median (roughly $384,000 per Redfin), so Tullahoma remains one of Middle Tennessee's genuine value plays.
Rates cooperated a little, too: the 30-year fixed spent June in the mid-6% range and eased to about 6.5% by month's end. For VA-eligible buyers near Arnold AFB, mid-6s rates plus zero-down eligibility plus rising inventory is a workable combination - details in the VA buyer's guide for Arnold AFB.
The catch: with supply at 3.55 months and 59 buyers going under contract in a single month, well-priced homes won't wait around. Get pre-approved before you tour, and be ready to move when the right one hits.
The Bottom Line for June
Tullahoma's June was a strong, tightening market with a discipline streak: demand jumped 50%, supply compressed by 30%, average prices set a June record - and yet overpriced listings still sat. Sellers who price to the market are getting rewarded quickly; buyers still have selection and a price point far below the state median. And the market splits sharply by property type: homes favor sellers at 3.55 months of supply, while land - at nearly 19 months - is one of the few corners where buyers hold the cards.
For the deeper local read - inventory by price band, what buyers are responding to, and how to time your move - visit the Tullahoma Market Report page, or the Coffee County Market Report for the wider area.
Have a question about your specific situation? Reach out directly or call (615) 610-1293 - I'm happy to give you a straight answer about whether now is your moment.
Jon Smith is a Tullahoma REALTOR® with Orchard, serving Tullahoma, Manchester, Winchester, Estill Springs, and the Arnold AFB / Tims Ford Lake area. Market statistics from Realtracs MLS (Residential: All; Residential: Single Family; Residential: Condo; Multi-Family; and Land, Lots, Farms; Tullahoma, TN; June 2026; report date 07/05/26). Mortgage rate data from Freddie Mac/Bankrate surveys; state median from Redfin. Statistics deemed reliable but not guaranteed and subject to MLS revision.