
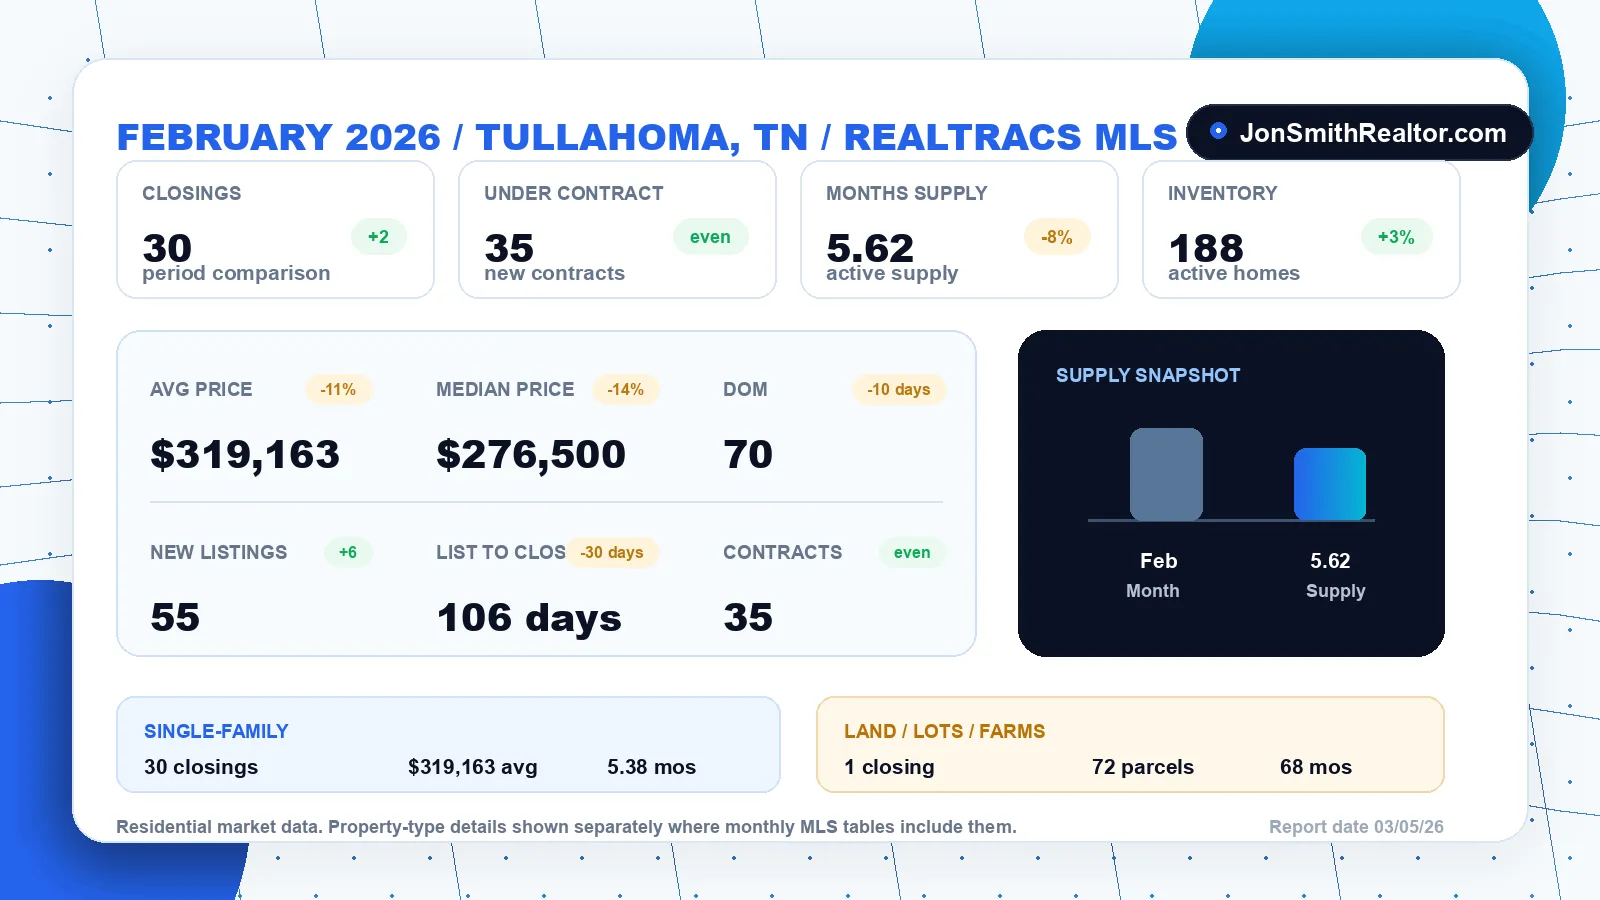

February's headline number looks alarming until you understand it: the median sale price dropped from $320,000 to $276,500 - down almost 14% in a month. Did Tullahoma home values fall 14% in thirty days? No. What happened is more interesting: February belonged to the entry-level buyer.
These numbers come straight from Realtracs MLS for Tullahoma. Here's the full picture versus January, then the breakdown by property type. (Missed last month? Start with the January baseline report.)
The Full Market: February 2026 by the Numbers
All residential, Tullahoma, TN - February 2026 vs. January 2026 (Realtracs MLS):
| Metric | Jan 2026 | Feb 2026 | Change |
|---|---|---|---|
| Closings | 28 | 30 | +2 |
| New under contract | 35 | 35 | even |
| New listings | 49 | 55 | +6 |
| Total inventory | 183 | 188 | +3% |
| Average sale price | $357,675 | $319,163 | −11% |
| Median sale price | $320,000 | $276,500 | −14% |
| Avg days on market (closed) | 80 | 70 | −10 days |
| List to closed (avg) | 136 days | 106 days | −30 days |
| Months of supply | 6.09 | 5.62 | −8% |
The Price Dip That Isn't a Crash
Both the median ($276,500) and average ($319,163) sale price fell double digits from January. When every price statistic moves together like that in a small market, it's almost always about which homes sold, not what homes are worth. February's 30 closings skewed heavily toward starter and mid-range homes - the under-$300K bands where Tullahoma's first-time buyers, downsizers, and Arnold AFB relocations live.
And there's a good reason those buyers picked February: mortgage rates broke below 6% late in the month - Freddie Mac's survey hit 5.98%, the first sub-6 reading in three and a half years. For payment-sensitive buyers, that's the starting gun. If you're shopping that segment, the homes under $300K and under $250K pages are where to watch.
Sellers of larger homes shouldn't read February as a markdown - the buyers for the upper bands simply weren't transacting yet. They show up with the spring.
The Market Quickened Underneath
Look past prices and February got faster. Homes that closed found their buyers in 70 days on average, down from 80. The full list-to-closing timeline dropped by a month - 136 days to 106. Supply tightened from 6.09 to 5.62 months. None of these are dramatic on their own; together they say the 2026 market was warming up ahead of schedule.
Breaking It Down by Property Type
Single-Family Homes
| Metric | Jan 2026 | Feb 2026 | Change |
|---|---|---|---|
| Closings | 27 | 30 | +3 |
| Average sale price | $362,589 | $319,163 | −12% |
| Median sale price | $325,000 | $276,500 | −15% |
| Avg days on market (closed) | 77 | 70 | −7 days |
| Total inventory | 175 | 180 | +3% |
| Months of supply | 6.0 | 5.38 | −10% |
Single-family homes were all 30 of February's residential closings - and the entry-level story above is entirely a single-family story this month.
Condos & Townhomes: No Sales, But a Listing Wave
No condos closed in February - but eight new condo and townhome listings hit the market, easily the biggest month for attached-home inventory in recent memory, and two went under contract. For a segment that usually offers buyers almost nothing to look at, February was the month to be paying attention.
Multi-Family: The Big Players Listed
No multi-family properties closed in February, but six new listings arrived - and the average multi-family asking price jumped past $2.1 million, which tells you these weren't duplexes. Larger apartment-scale properties came to market in February. For everyday investors, note the distinction: what actually sells in Tullahoma multi-family is small-property stock in the $300K range; the seven-figure listings are a different game with a much smaller buyer pool.
Land, Lots & Farms: One Sale, Long Waits
One parcel closed in February at $220,000, against 72 in inventory - land remains Tullahoma's deepest buyer's market by far, with sellers routinely waiting months or years. Six parcels did go under contract, though, hinting at land demand building for spring. Browse current Tullahoma land for sale.
What This Means for Sellers
If you own an entry-level or mid-range home, February proved your buyer pool is active even in winter - and willing to move fast when rates cooperate. If you're in the upper bands, don't let February's median spook you into underpricing a spring listing; your segment's buyers arrive with warmer weather, and the smart move now is preparation. Either way, pricing off real comps - not headlines - is everything. A free Tullahoma home value review will tell you exactly which market you're actually in.
What This Means for Buyers
February offered a rare alignment: sub-6% rates, 188 homes in inventory, 70-day market times, and sellers still in winter negotiating mode. The buyers who moved caught the best affordability window Tullahoma had seen in years. Rate dips like that don't announce themselves in advance - which is why the practical lesson is to have your pre-approval done before the window opens, so you can act inside it. First time doing this? Start with the first-time buyer's guide.
The Bottom Line for February
February 2026 was the entry-level market's month: volume up slightly, timelines a month faster, supply tightening, and a price dip that reflects who was buying, not falling values. Underneath the quiet, the spring market was clearly loading up - more listings, more pending deals, and a rate environment pulling buyers off the fence.
For the deeper local read - inventory by price band, what buyers are responding to, and how to time your move - visit the Tullahoma Market Report page, or the Coffee County Market Report for the wider area.
Have a question about your specific situation? Reach out directly or call (615) 610-1293.
Jon Smith is a Tullahoma REALTOR® with Orchard, serving Tullahoma, Manchester, Winchester, Estill Springs, and the Arnold AFB / Tims Ford Lake area. Market statistics from Realtracs MLS (Residential: All; Residential: Single Family; Residential: Condo; Multi-Family; and Land, Lots, Farms; Tullahoma, TN; February 2026; report date 07/05/26). Mortgage rate data from Freddie Mac's Primary Mortgage Market Survey. Statistics deemed reliable but not guaranteed and subject to MLS revision.