Middle Tennessee Mid-Month Market Update, October 2026: Nashville, Murfreesboro, Tullahoma, Manchester and Winchester
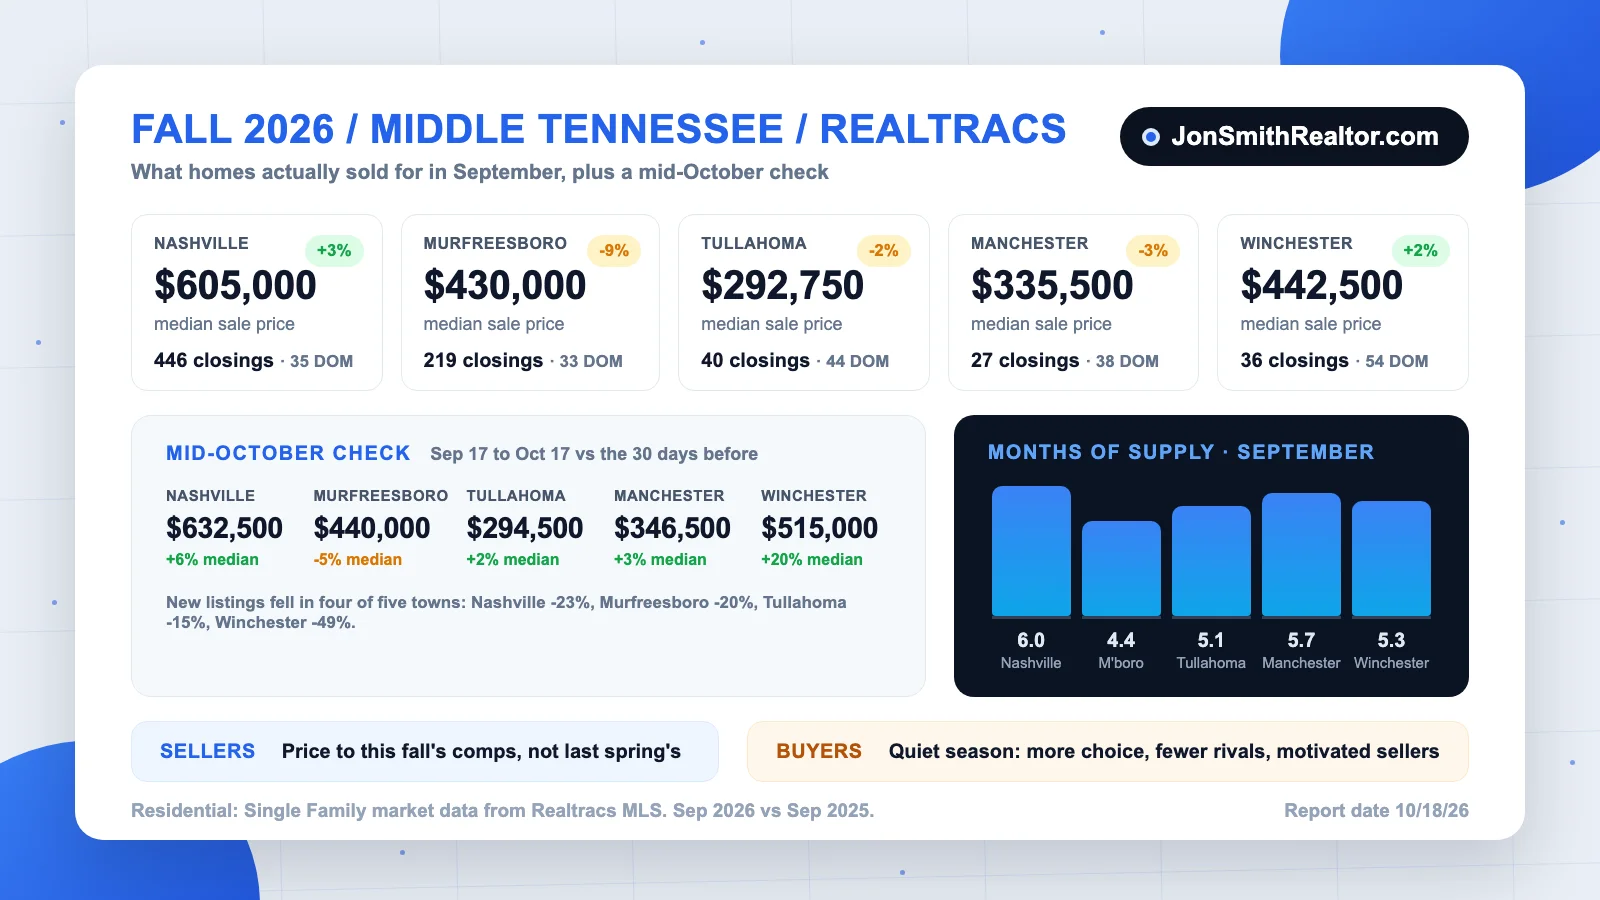
Here is what actually happened in the Middle Tennessee housing market this fall, from Nashville down to Winchester. Every number below is a closed sale from the Realtracs MLS, single-family residential only. No list prices, no online estimates.
Two views for each town. First, September 2026 against September 2025, so you can see the year-over-year trend. Second, the most recent 30 days (September 17 to October 17, 2026) against the 30 days before that, so you can see where things are heading right now.
The short version: the market has slowed in a healthy way. Buyers have more to choose from, homes take a little longer to sell, and prices are mostly holding. Fewer sellers are listing as we head toward the holidays, and that is what keeps prices from slipping.
Nashville
| September 2026 | Value | vs. September 2025 |
|---|---|---|
| Closed sales | 446 | -11% |
| Median sale price | $605,000 | +3% |
| Days on market | 35 | flat |
| Homes for sale | 2,301 | +4% |
| New listings | 858 | -19% |
| Months of supply | 6.0 |
| Last 30 days | Sep 17 to Oct 17 | Prior 30 days | Change |
|---|---|---|---|
| Closed sales | 393 | 437 | -10% |
| Median sale price | $632,500 | $595,000 | +6% |
| Days on market | 38 | 30 | +8 days |
| New listings | 677 | 883 | -23% |
| New contracts | 389 | 414 | -6% |
| Homes for sale | 2,327 |
Fewer homes are coming on the market, so prices stay firm even with fewer sales. Nashville is sitting right around six months of supply, the textbook definition of a balanced market. Neither buyers nor sellers have the upper hand right now.
Murfreesboro
| September 2026 | Value | vs. September 2025 |
|---|---|---|
| Closed sales | 219 | -19% |
| Median sale price | $430,000 | -9% (from $471,190) |
| Days on market | 33 | up from 27 |
| Homes for sale | 821 | +2% |
| New listings | 412 | -17% |
| New contracts | 252 | +2% |
| Months of supply | 4.4 |
| Last 30 days | Sep 17 to Oct 17 | Prior 30 days | Change |
|---|---|---|---|
| Closed sales | 220 | 232 | -5% |
| Median sale price | $440,000 | $462,450 | -5% |
| Days on market | 34 | 30 | +4 days |
| New listings | 338 | 420 | -20% |
| New contracts | 203 | 234 | -13% |
| Homes for sale | 836 |
Murfreesboro is the one market here where the median moved down meaningfully. Part of that is mix: more of what sold in September was in the lower price bands. Part of it is real. Sellers who priced like it was 2025 sat, and sellers who priced to the current comps got offers. The mid-October median recovered to $440,000, so this looks like a market settling, not sliding. If you are thinking about listing in Rutherford County, the price you pick on day one matters more than it has in years.
Tullahoma
| September 2026 | Value | vs. September 2025 |
|---|---|---|
| Closed sales | 40 | +14% (from 35) |
| Median sale price | $292,750 | -2% |
| Days on market | 44 | down from 50 |
| Homes for sale | 167 | -2% |
| New listings | 78 | +47% (from 53) |
| New contracts | 37 | +12% |
| Months of supply | 5.1 |
| Last 30 days | Sep 17 to Oct 17 | Prior 30 days | Change |
|---|---|---|---|
| Closed sales | 39 | 37 | +5% |
| Median sale price | $294,500 | $290,000 | +2% |
| Days on market | 42 | 63 | -21 days |
| New listings | 68 | 80 | -15% |
| New contracts | 39 | 42 | -7% |
| Homes for sale | 184 | 162 | +14% |
Tullahoma has the healthiest set of numbers in the group. More homes came on, more went under contract, and they are selling three weeks faster than they were a month ago, with prices steady. Inventory is up 14% in a month, so buyers finally have real choices here.
Manchester
| September 2026 | Value | vs. September 2025 |
|---|---|---|
| Closed sales | 27 | -48% (from 52) |
| Median sale price | $335,500 | -3% |
| Days on market | 38 | down from 43 |
| Homes for sale | 127 | -12% |
| New listings | 51 | -12% |
| New contracts | 25 | -24% |
| Months of supply | 5.7 |
| Last 30 days | Sep 17 to Oct 17 | Prior 30 days | Change |
|---|---|---|---|
| Closed sales | 30 | 25 | +20% |
| Median sale price | $346,500 | $335,500 | +3% |
| Days on market | 43 | 35 | +8 days |
| New listings | 48 | 45 | +7% |
| New contracts | 24 | 28 | -14% |
| Homes for sale | 128 |
Manchester had a quiet September, with half as many closings as a year ago, but the mid-October numbers picked right back up and the median climbed. Buyers are still there, they are just being picky. Clean, well-priced homes are moving. Everything else is waiting.
Winchester
| September 2026 | Value | vs. September 2025 |
|---|---|---|
| Closed sales | 36 | +89% (from 19) |
| Median sale price | $442,500 | +2% |
| Days on market | 54 | down from 56 |
| Homes for sale | 161 | +18% |
| New listings | 51 | +31% |
| New contracts | 29 | more than double (from 13) |
| Months of supply | 5.3 |
| Last 30 days | Sep 17 to Oct 17 | Prior 30 days | Change |
|---|---|---|---|
| Closed sales | 27 | 28 | -4% |
| Median sale price | $515,000 | $428,000 | +20% |
| Days on market | 66 | 56 | +10 days |
| New listings | 26 | 51 | -49% |
| New contracts | 20 | 29 | -31% |
| Homes for sale | 162 |
Winchester and the Tims Ford area had the strongest September of the five towns: closings nearly doubled and contracts more than doubled from a year ago. The $515,000 median for the last 30 days is a small sample with a few lake homes in it, so do not read too much into that jump. The real story is supply. New listings fell by half in the last 30 days. If you own here and have thought about selling, you would have very little competition right now.
What this means if you are selling
Pricing is the whole game right now. In every one of these towns, the homes that sold were the ones priced against this fall's comps, not last spring's. Homes that sat were almost always overpriced by 3 to 5 percent at launch. If you want a number for your specific house, reach out and I will run it for you. No obligation.
What this means if you are buying
This is the best stretch of the year to buy. Inventory is up or steady everywhere, sellers still on the market in November are motivated, and you are competing with far fewer buyers than you were in May. If you have been waiting for the market to calm down, it has.
Source: Realtracs MLS, Residential: Single Family closed sales. September 2026 compared to September 2025, and September 17 to October 17, 2026 compared to the 30 days before. Data pulled October 18, 2026. Information is believed accurate but not guaranteed.
Categories: Middle Tennessee Real Estate
Tags: market report, Nashville, murfreesboro, tullahoma, manchester, winchester, October 2026, Realtracs MLS